Message From CEO
Our Services
1,074,363,651
Energy Savings (KWH)
1,038,078,411
Water Savings(IG)
441,226
Carbon Savings (kgCO2e)
Our Projects
- All
- Retrofit
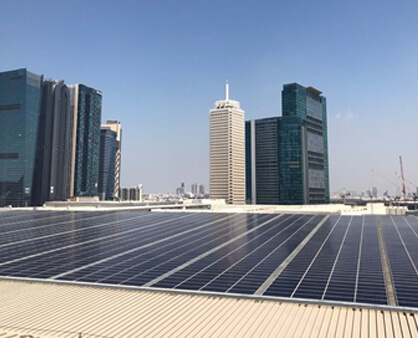
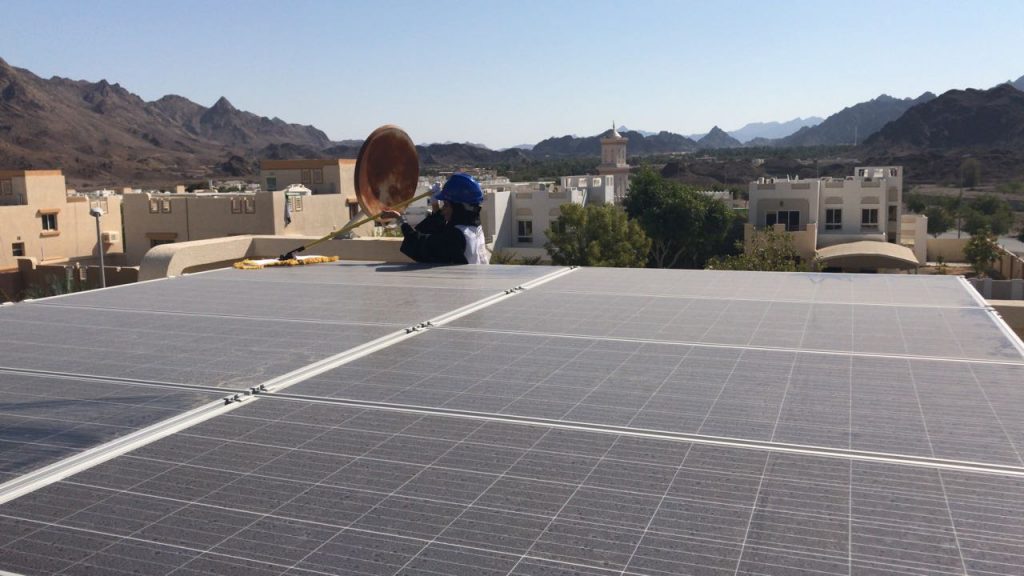
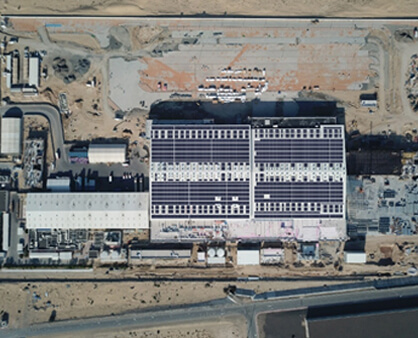
- Solar


Press Releases
December, 2023
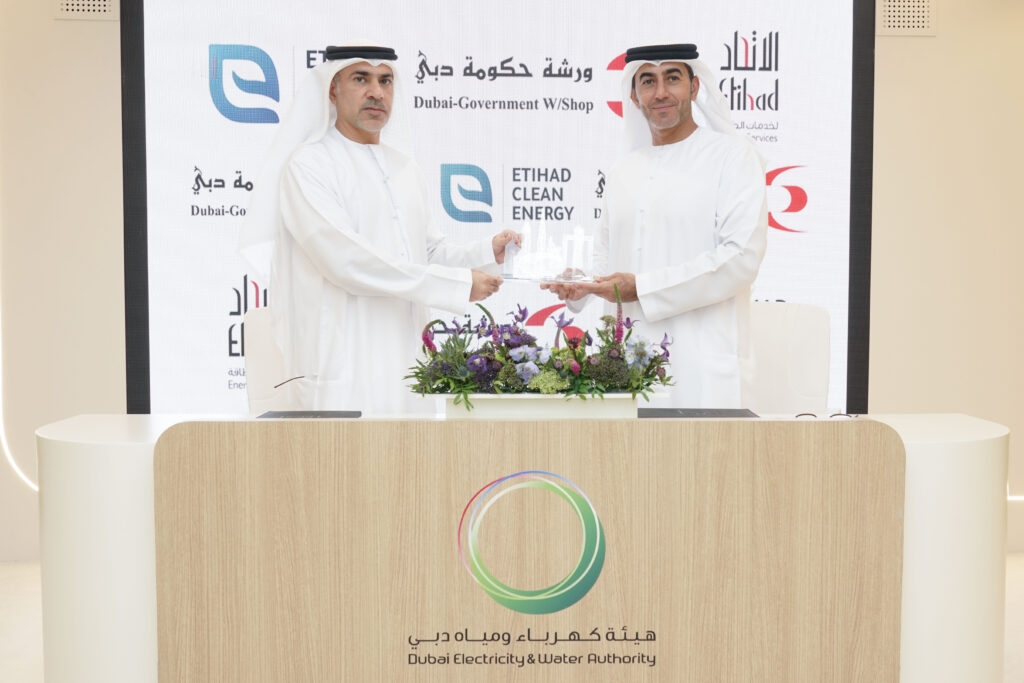
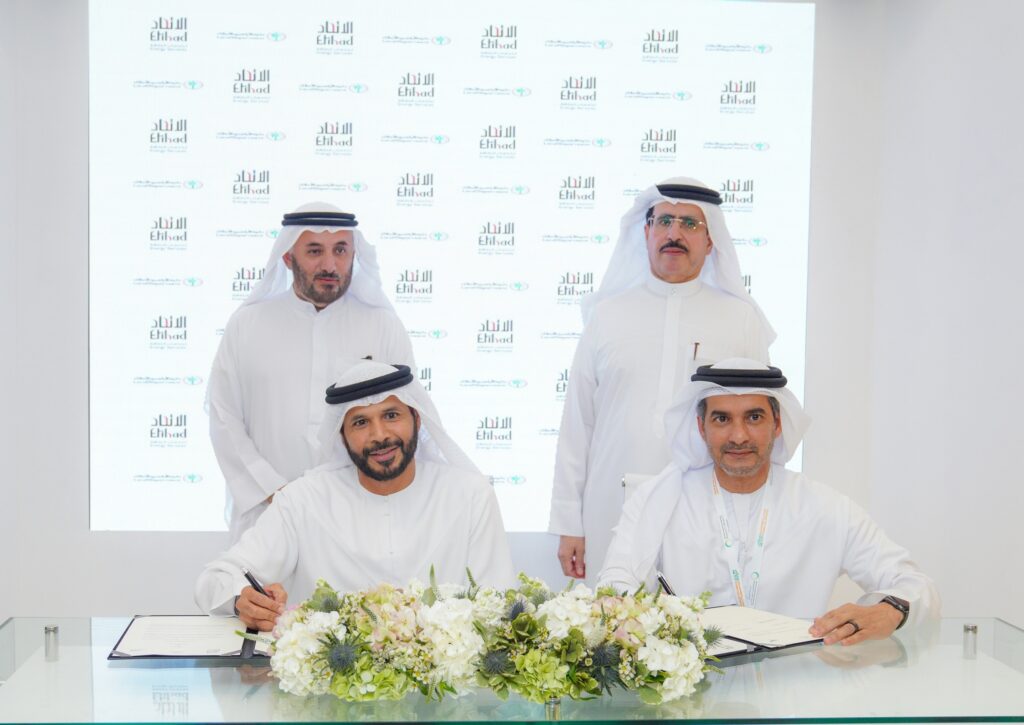
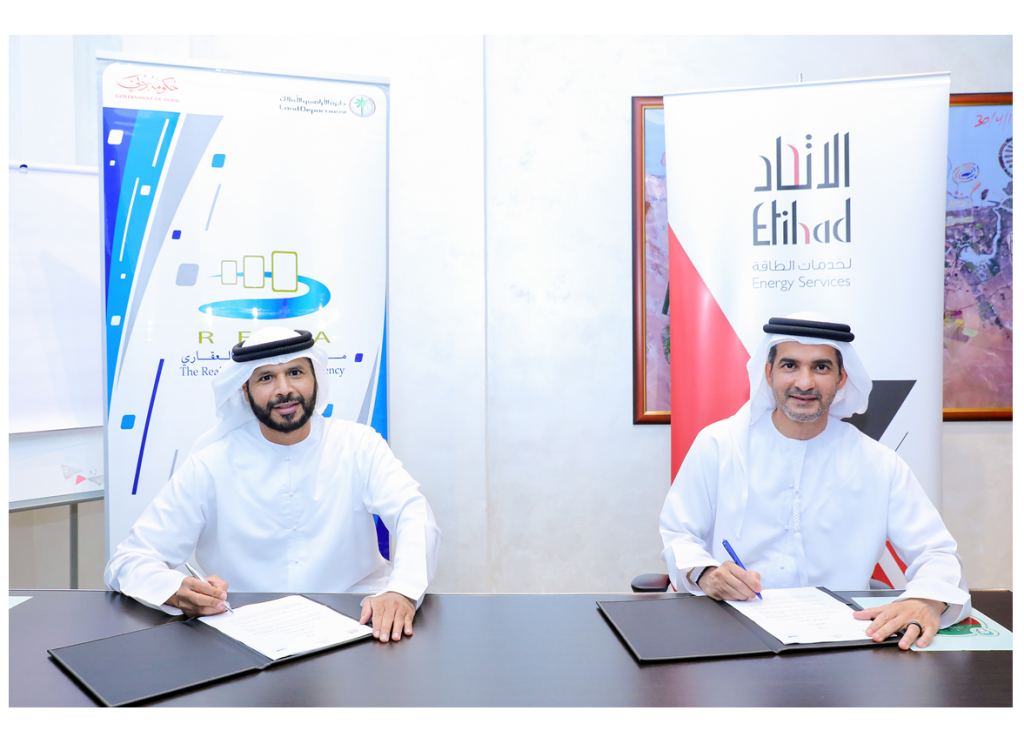
Etihad Energy Services and Dubai Government Workshop Partner for Sustainability in Dubai
Etihad Energy Services proudly announces a partnership with Dubai Government Workshop, a landmark 20-year collaboration, reinforcing a shared commitment to sustainability and environmental goals in Dubai.


19 May, 2021
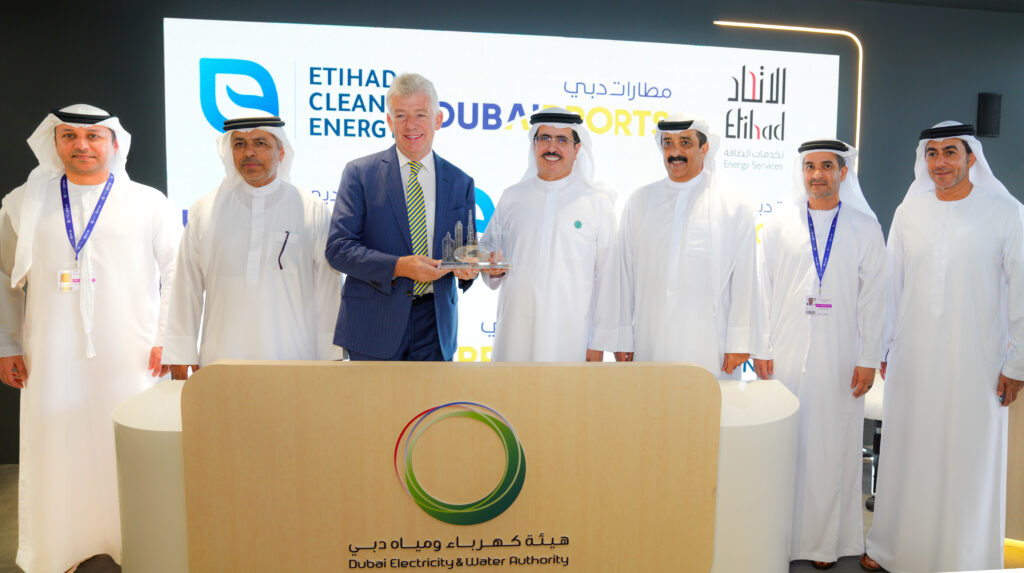
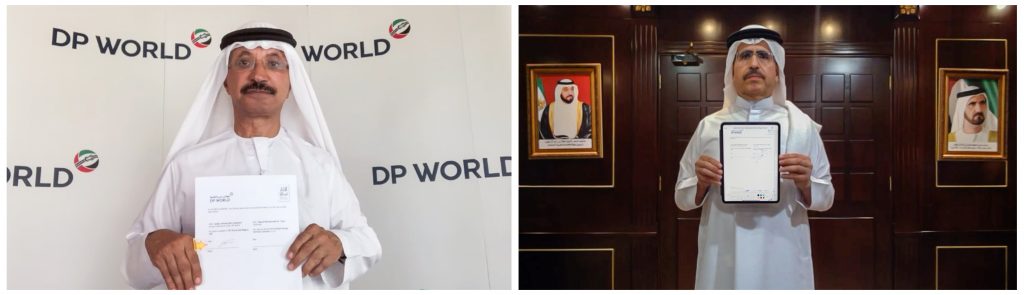
DP WORLD, UAE REGION TO EXPAND ENERGY EFFICIENCY COLLABORATION WITH ETIHAD ESCO
DP World, UAE Region, the leading smart trade enabler, and Etihad Energy Services Company (Etihad ESCO), a wholly-owned subsidiary of Dubai Electricity and Water Authority (DEWA), announced plans to expand their ongoing energy efficiency….
Latest Events

Retrofittech UAE 2022
March 22 – 23, 2022, Events

Wetex
October 26 – 28, 2020, Events

Retrofittech UAE 2020
September 7-8, 2020 , Events

Wetex
October 21 – 23, 2019, Events